Home
Work
AI Journal
About
Contact
Home
Work
AI Journal
About
Contact
© 2025 Created by
Pedro Laboy
digital
5 articles
Home
digital
#Artifical Intelligence
#Business
#Business Intelligence
#digital
#digital transformation
#strategy
#Technology
3 mins to read
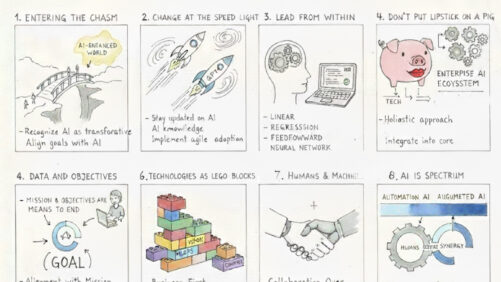
Eight Foundational AI Principles for Business Leaders
Pedro Laboy
April 9, 2023
Read More
#agency
#digital
#digital transformation
#ecommerce
#Marketing ROI
#media
#retail
#strategy
5 mins to read
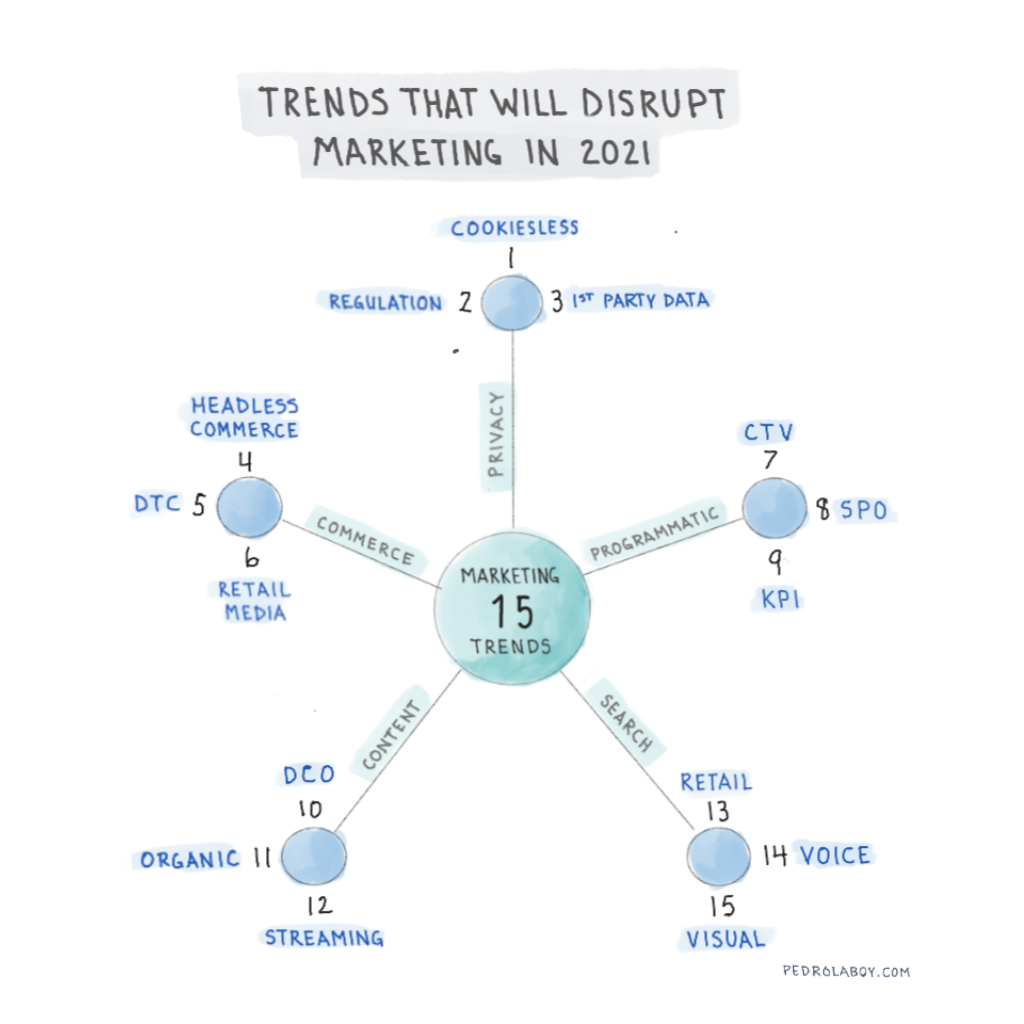
Notebook Thoughts: 15 Trends That Are Disrupting Marketing
Pedro Laboy
May 29, 2021
Read More
#digital
#digital transformation
#ecommerce
#Marketing ROI
#MarTech
#media
#retail
#social media
#strategy
2 mins to read
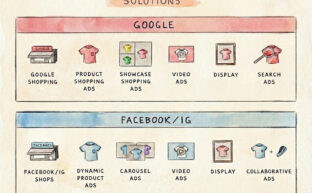
Notebook Thoughts: Google vs Facebook Ecommerce Solutions
Pedro Laboy
May 1, 2021
Read More
#agency
#digital
#digital transformation
#ecommerce
#Marketing ROI
#media
#retail
#strategy
1 min to read
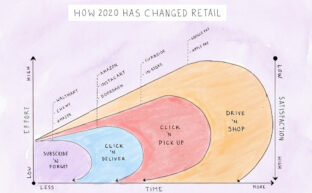
Notebook Thoughts: How Covid Changed Retail
Pedro Laboy
November 10, 2020
Read More
#digital
#digital transformation
#ecommerce
#Marketing ROI
#MarTech
#media
#retail
#strategy
1 min to read
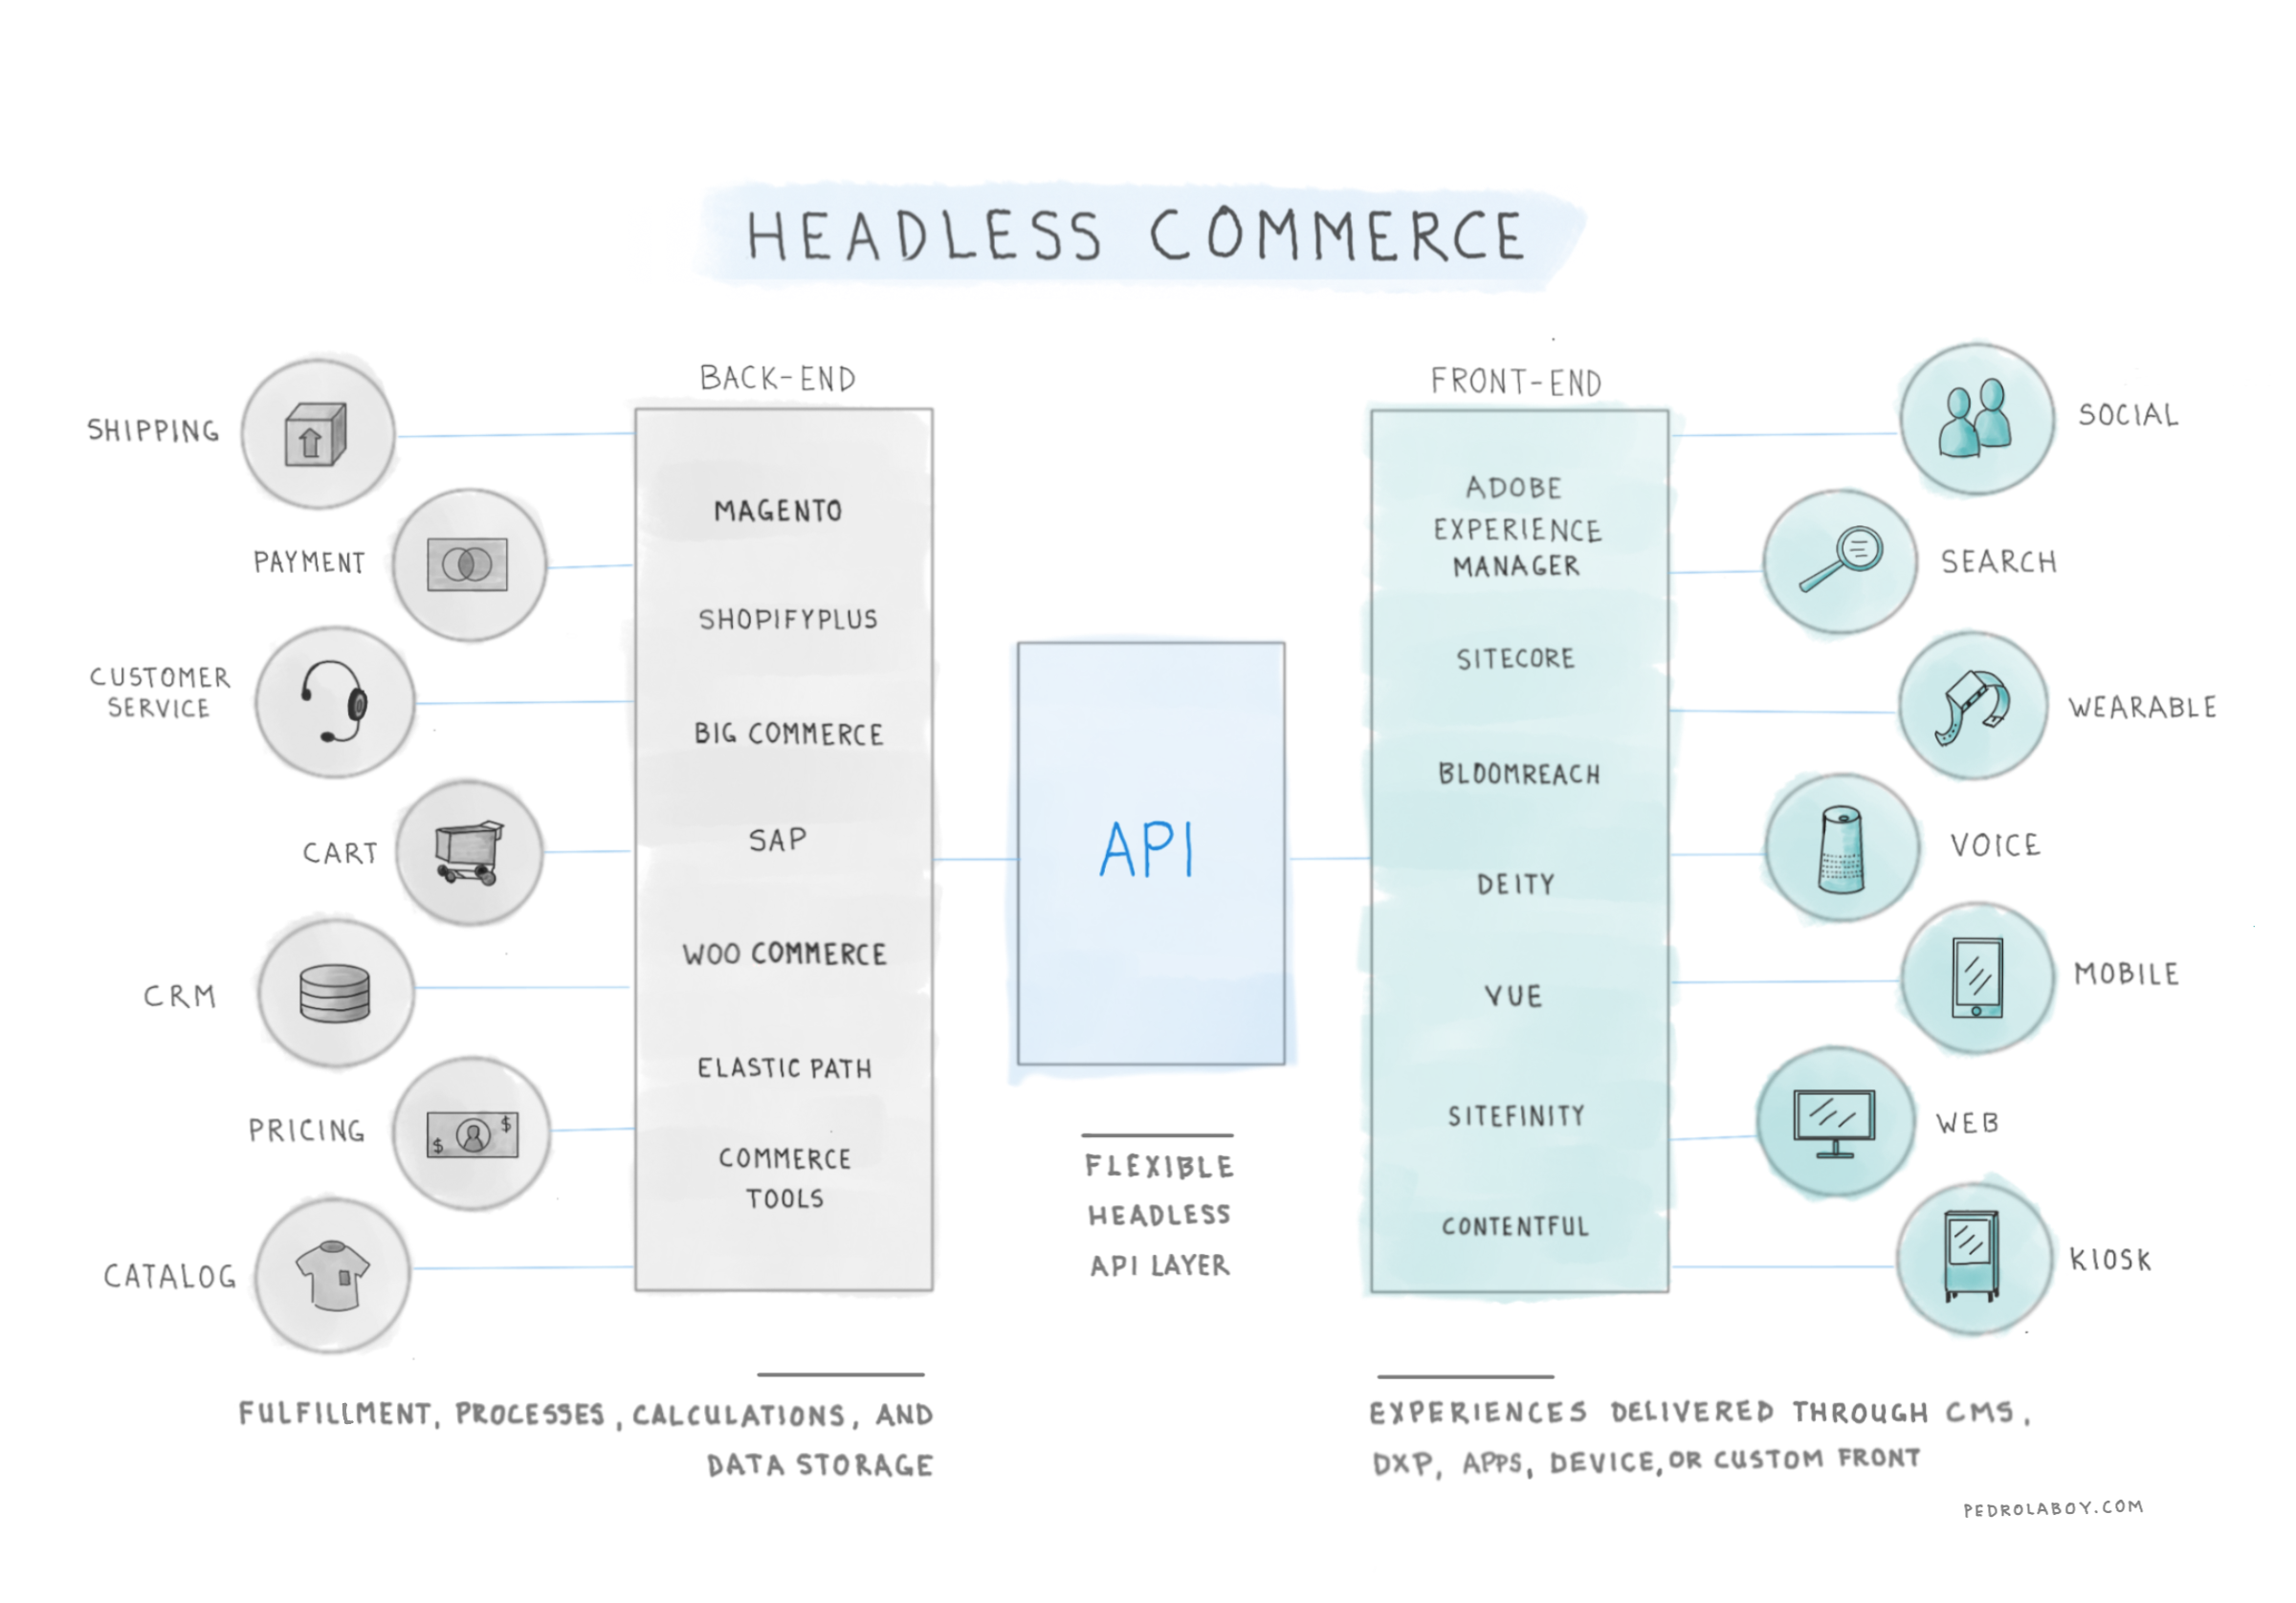
Notebook Thoughts: Understanding Headless Commerce
Pedro Laboy
November 7, 2020
Read More