Home
Work
AI Journal
About
Contact
Home
Work
AI Journal
About
Contact
© 2025 Created by
Pedro Laboy
Algorithmic Attribution
1 article
Home
Algorithmic Attribution
#Algorithmic Attribution
#Analytics
#Attribution
#Machine Learning
#Marketing ROI
#Multitouch Attribution
2 mins to read
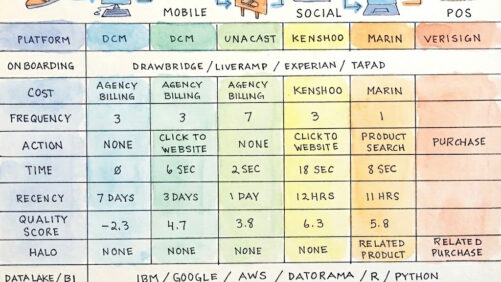
Notebook Thoughts: Understanding Marketing Attribution
Pedro Laboy
May 30, 2018
Read More