Home
Work
AI Journal
About
Contact
Home
Work
AI Journal
About
Contact
© 2025 Created by
Pedro Laboy
Analytics
12 articles
Home
Analytics
#AdTech
#Analytics
#Business Intelligence
#Contextual Targeting
#Data Science
#data story
#Measurement
#media
#Performance
#visualization
1 min to read
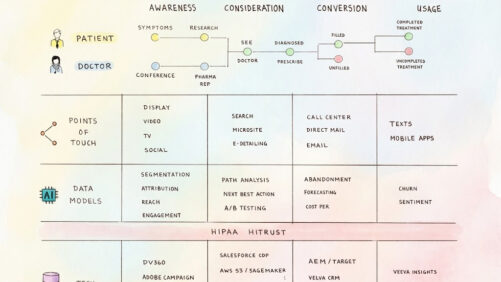
Notebook Thoughts: Enabling the Healthcare Journey
Pedro Laboy
December 7, 2022
Read More
#AdTech
#Analytics
#Business Intelligence
#Contextual Targeting
#Data Science
#data story
#Measurement
#media
#Performance
#visualization
1 min to read
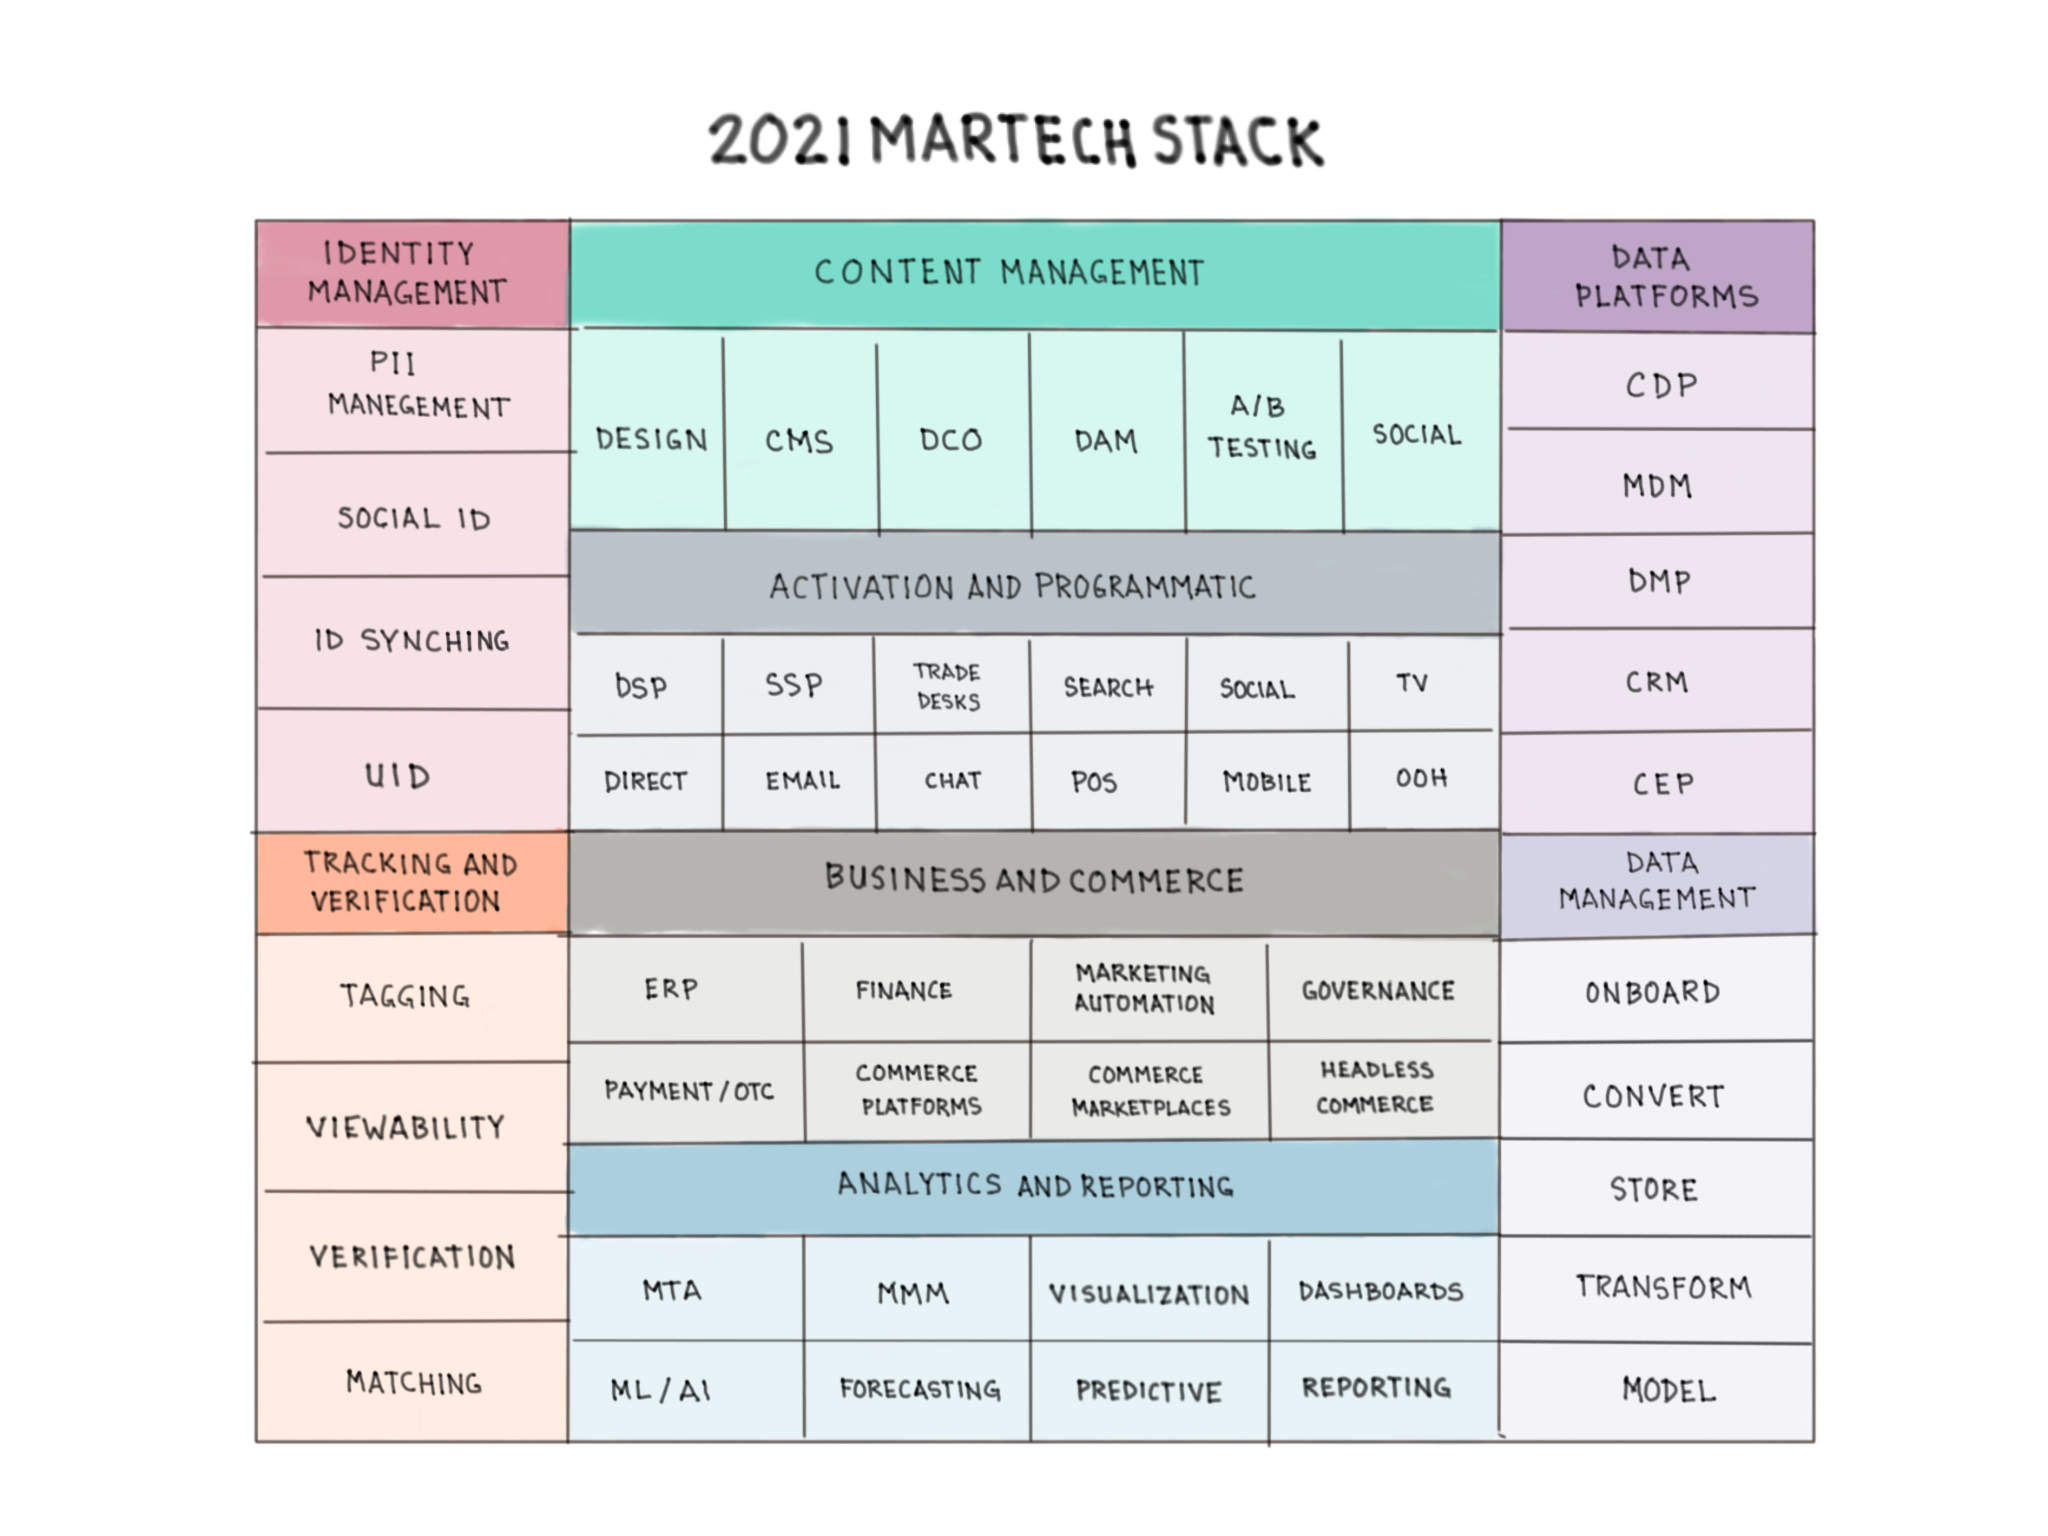
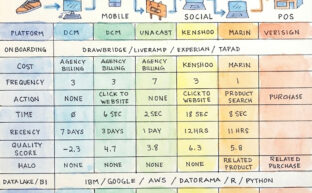
Notebook Thoughts: The Modern Technology Stack
Pedro Laboy
November 17, 2021
Read More
#AdTech
#Analytics
#Business Intelligence
#Contextual Targeting
#Data Science
#data story
#Measurement
#media
#Performance
#visualization
2 mins to read
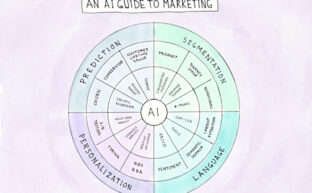
Notebook Thoughts: An AI Guide to Marketing
Pedro Laboy
May 23, 2021
Read More
#AdTech
#Analytics
#Business Intelligence
#Contextual Targeting
#Data Science
#data story
#Measurement
#media
#Performance
#visualization
1 min to read
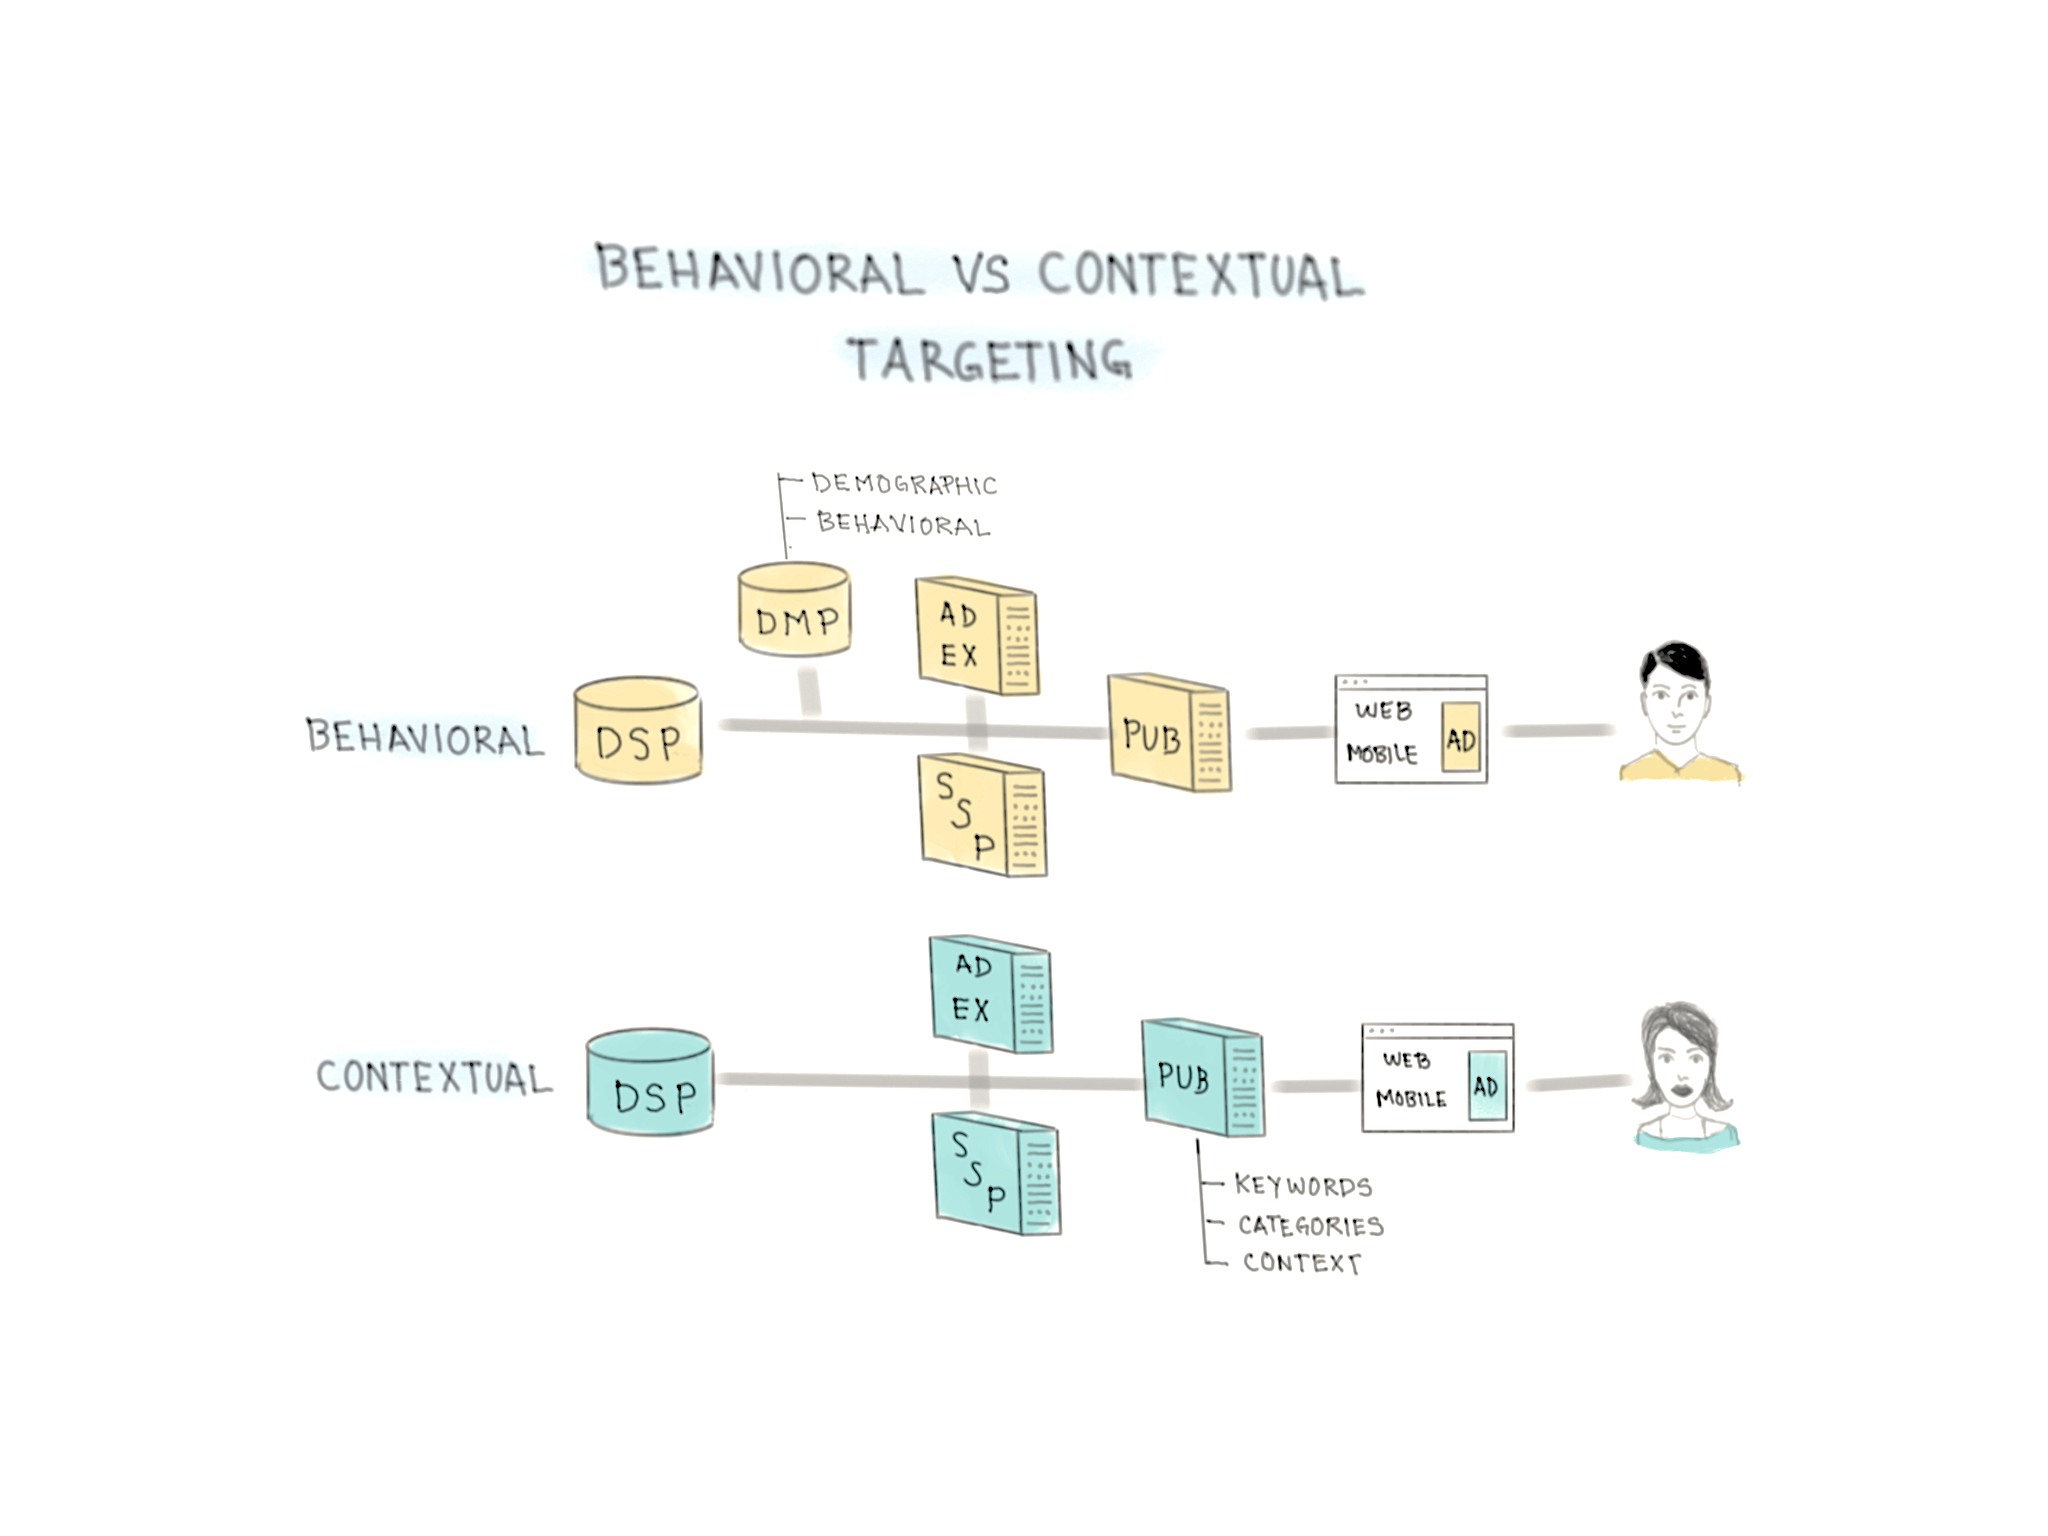
Notebook Thoughts: Behavioral vs Contextual Targeting
Pedro Laboy
March 20, 2021
Read More
#Analytics
#Business Intelligence
#Data Science
#data story
#Measurement
#Performance
#visualization
1 min to read
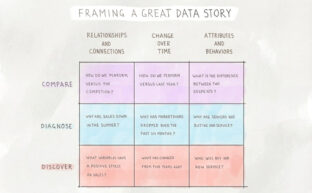
Notebook Thoughts: The Foundation of a Great Data Story
Pedro Laboy
February 24, 2021
Read More
#Algorithms
#Analytics
#Artifical Intelligence
#Data Science
#Machine Learning
2 mins to read
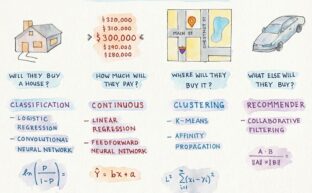
Notebook Thoughts: Choosing the Right AI Algorithm for the Right Problem
Pedro Laboy
October 15, 2019
Read More
#Algorithms
#Analytics
#brand health
#Data Science
#Machine Learning
#sentiment
#social analytics
#social media
2 mins to read
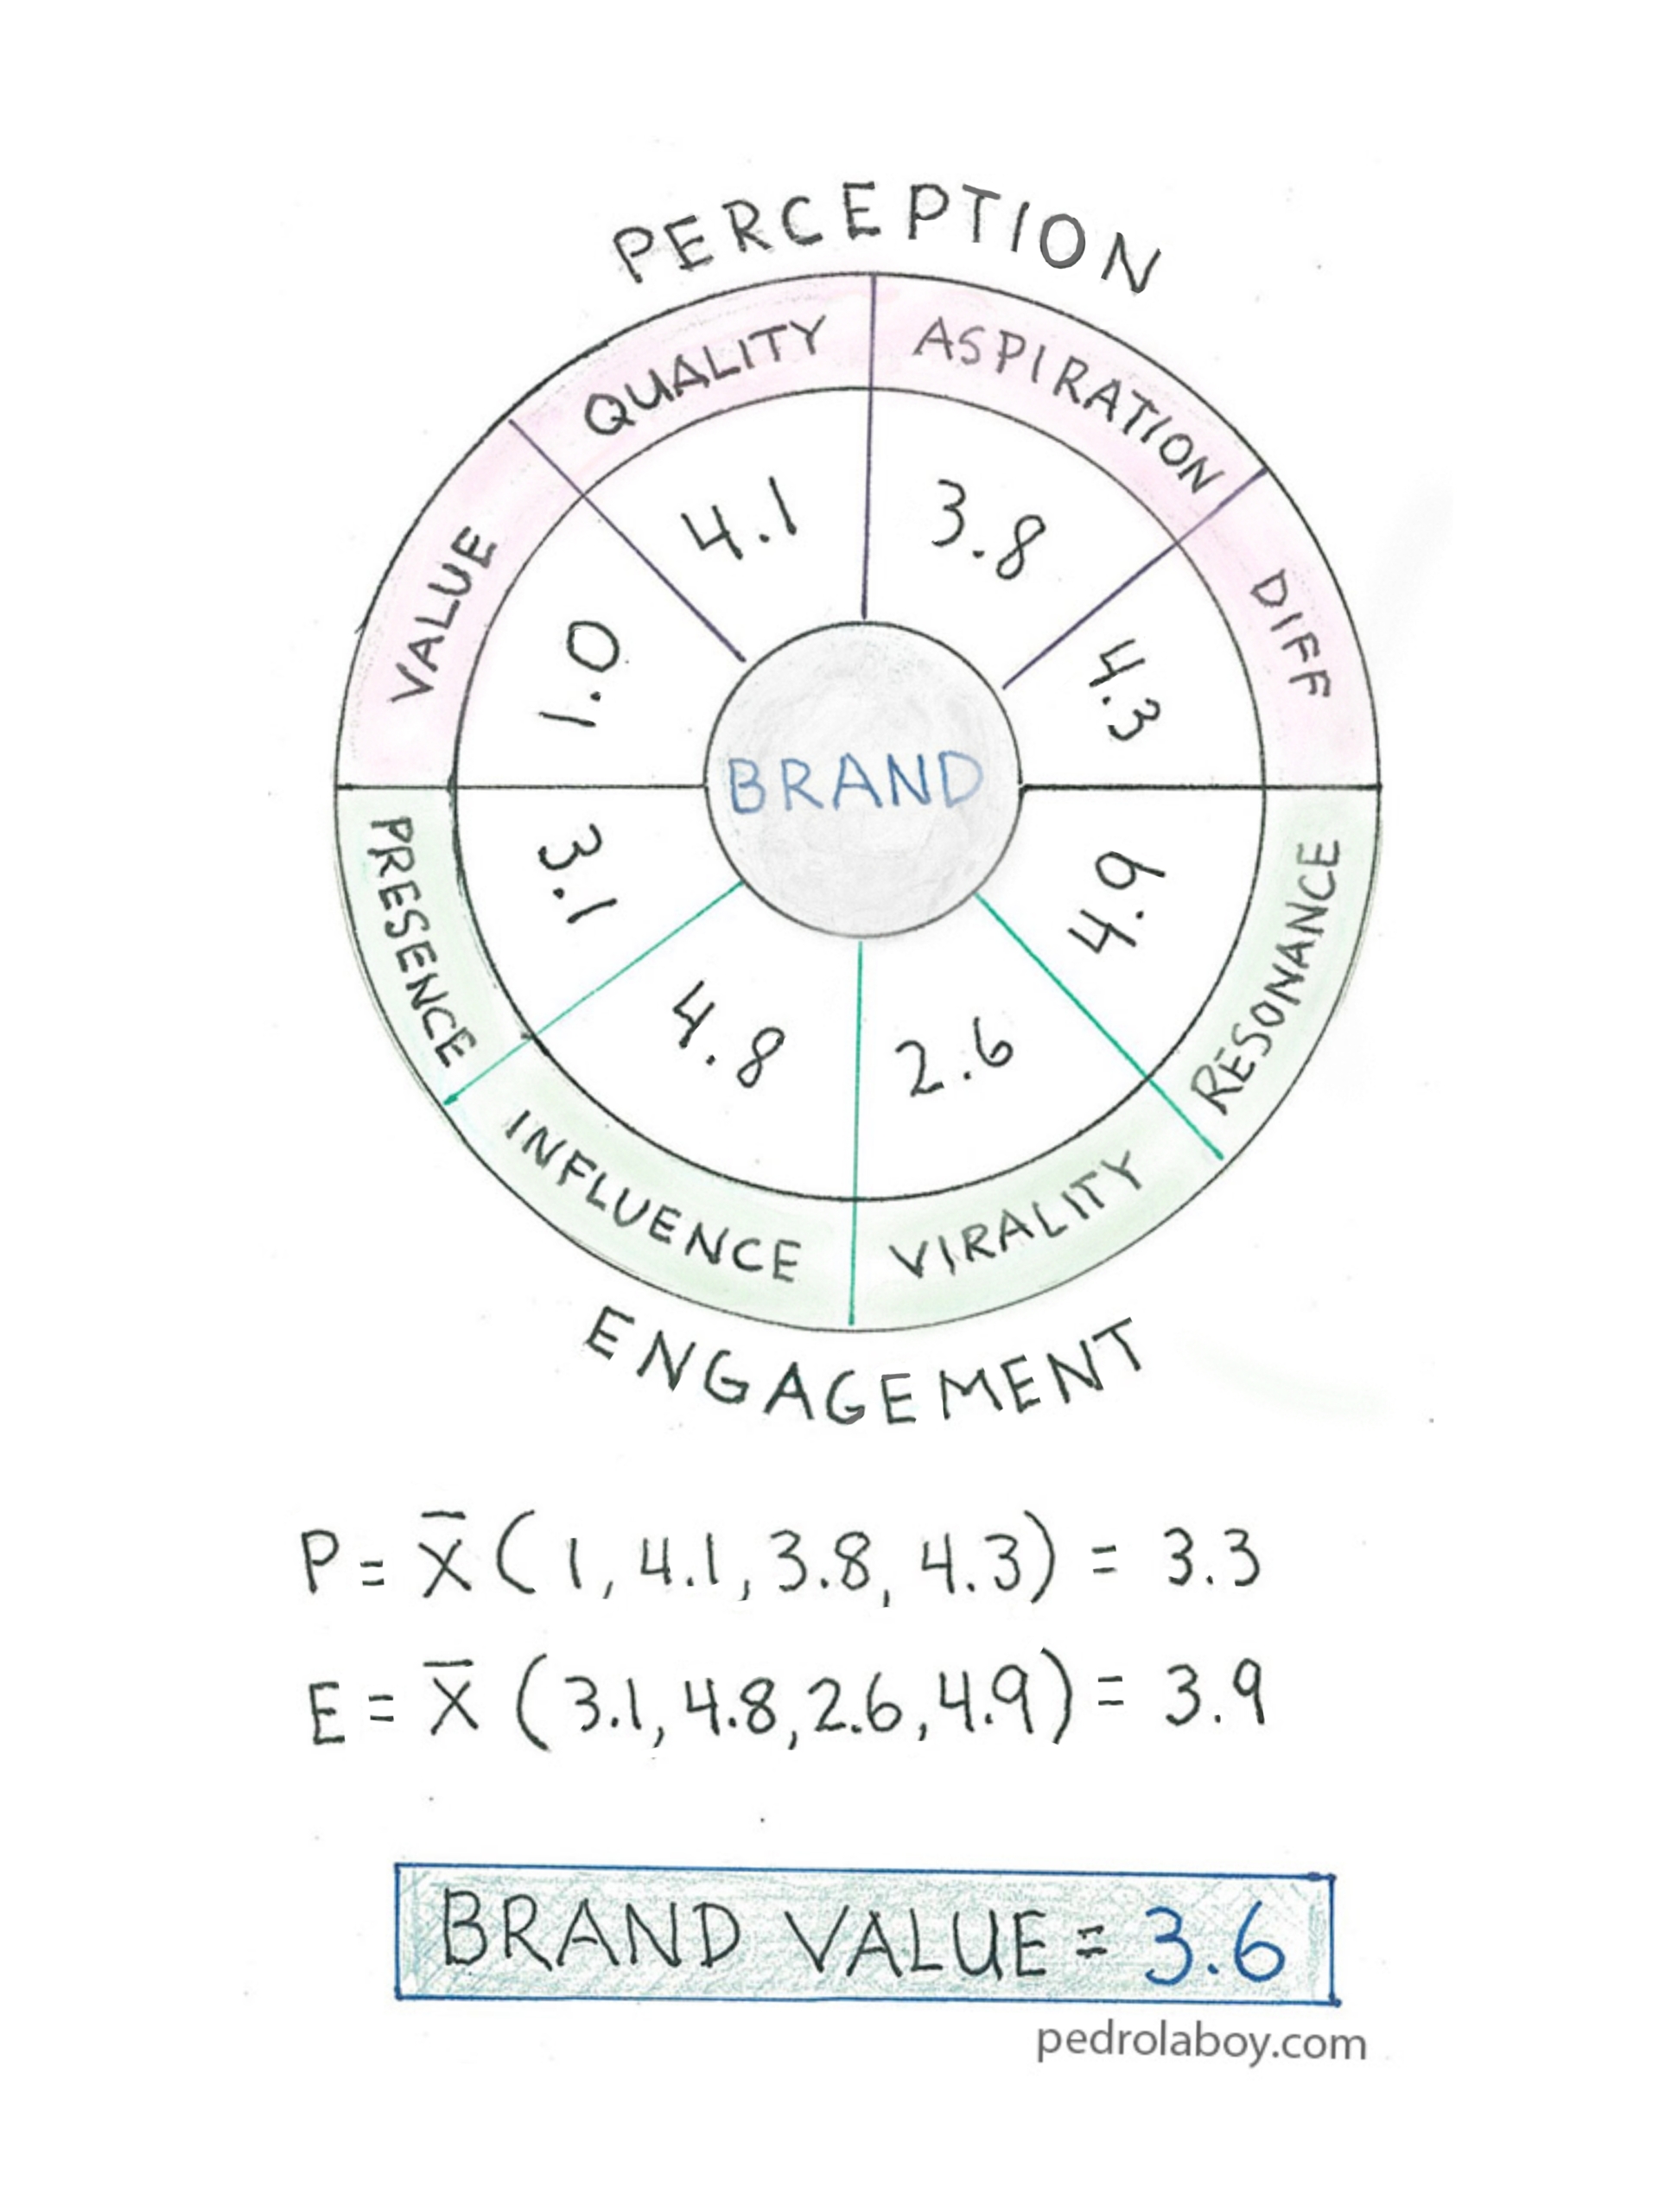
Notebook Thoughts: Using Social Media to Measure Brand Health
Pedro Laboy
May 26, 2019
Read More
#Algorithmic Attribution
#Analytics
#Attribution
#Machine Learning
#Marketing ROI
#Multitouch Attribution
2 mins to read
Notebook Thoughts: Understanding Marketing Attribution
Pedro Laboy
May 30, 2018
Read More
1
2