Home
Work
AI Journal
About
Contact
Home
Work
AI Journal
About
Contact
© 2025 Created by
Pedro Laboy
Machine Learning
11 articles
Home
Machine Learning
#AI Agents
#Artifical Intelligence
#LLMs
#Machine Learning
7 mins to read
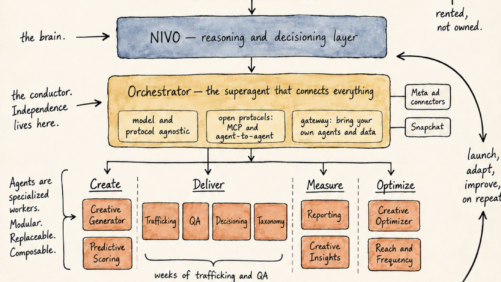
Stop Betting Your AI Strategy on a Model
Pedro Laboy
June 16, 2026
Read More
#AI Agents
#Artifical Intelligence
#LLMs
#Machine Learning
6 mins to read
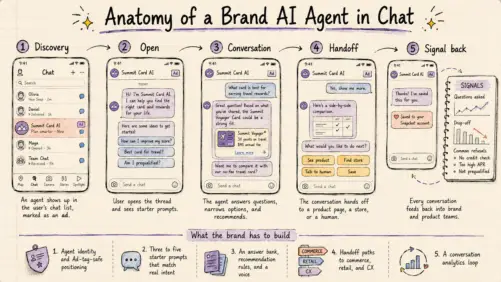
The Branded AI Agent Playbook
Pedro Laboy
April 28, 2026
Read More
#AI Agents
#Artifical Intelligence
#LLMs
#Machine Learning
7 mins to read
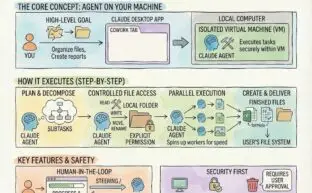
Claude Cowork: Your AI Desktop Agent
Pedro Laboy
March 30, 2026
Read More
#AI Agents
#Artifical Intelligence
#LLMs
#Machine Learning
3 mins to read
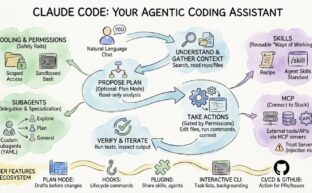
Claude Code: Your First AI Employee
Pedro Laboy
February 18, 2026
Read More
#AI Agents
#Artifical Intelligence
#LLMs
#Machine Learning
7 mins to read
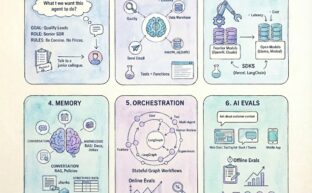
How I Explain “How To Build an AI Agent”
Pedro Laboy
November 24, 2025
Read More
#AI Agents
#Artifical Intelligence
#digital transformation
#LLMs
#Machine Learning
#RAG
#strategy
#Technology
4 mins to read
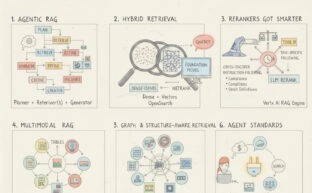
Modern RAG: From Simple Pipelines to Agentic Knowledge Systems
Pedro Laboy
May 11, 2025
Read More
#Algorithms
#Analytics
#Artifical Intelligence
#Data Science
#Machine Learning
2 mins to read
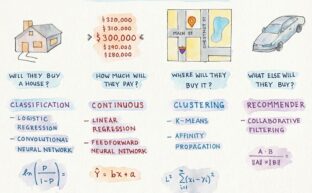
Notebook Thoughts: Choosing the Right AI Algorithm for the Right Problem
Pedro Laboy
October 15, 2019
Read More
#Algorithms
#Analytics
#brand health
#Data Science
#Machine Learning
#sentiment
#social analytics
#social media
2 mins to read
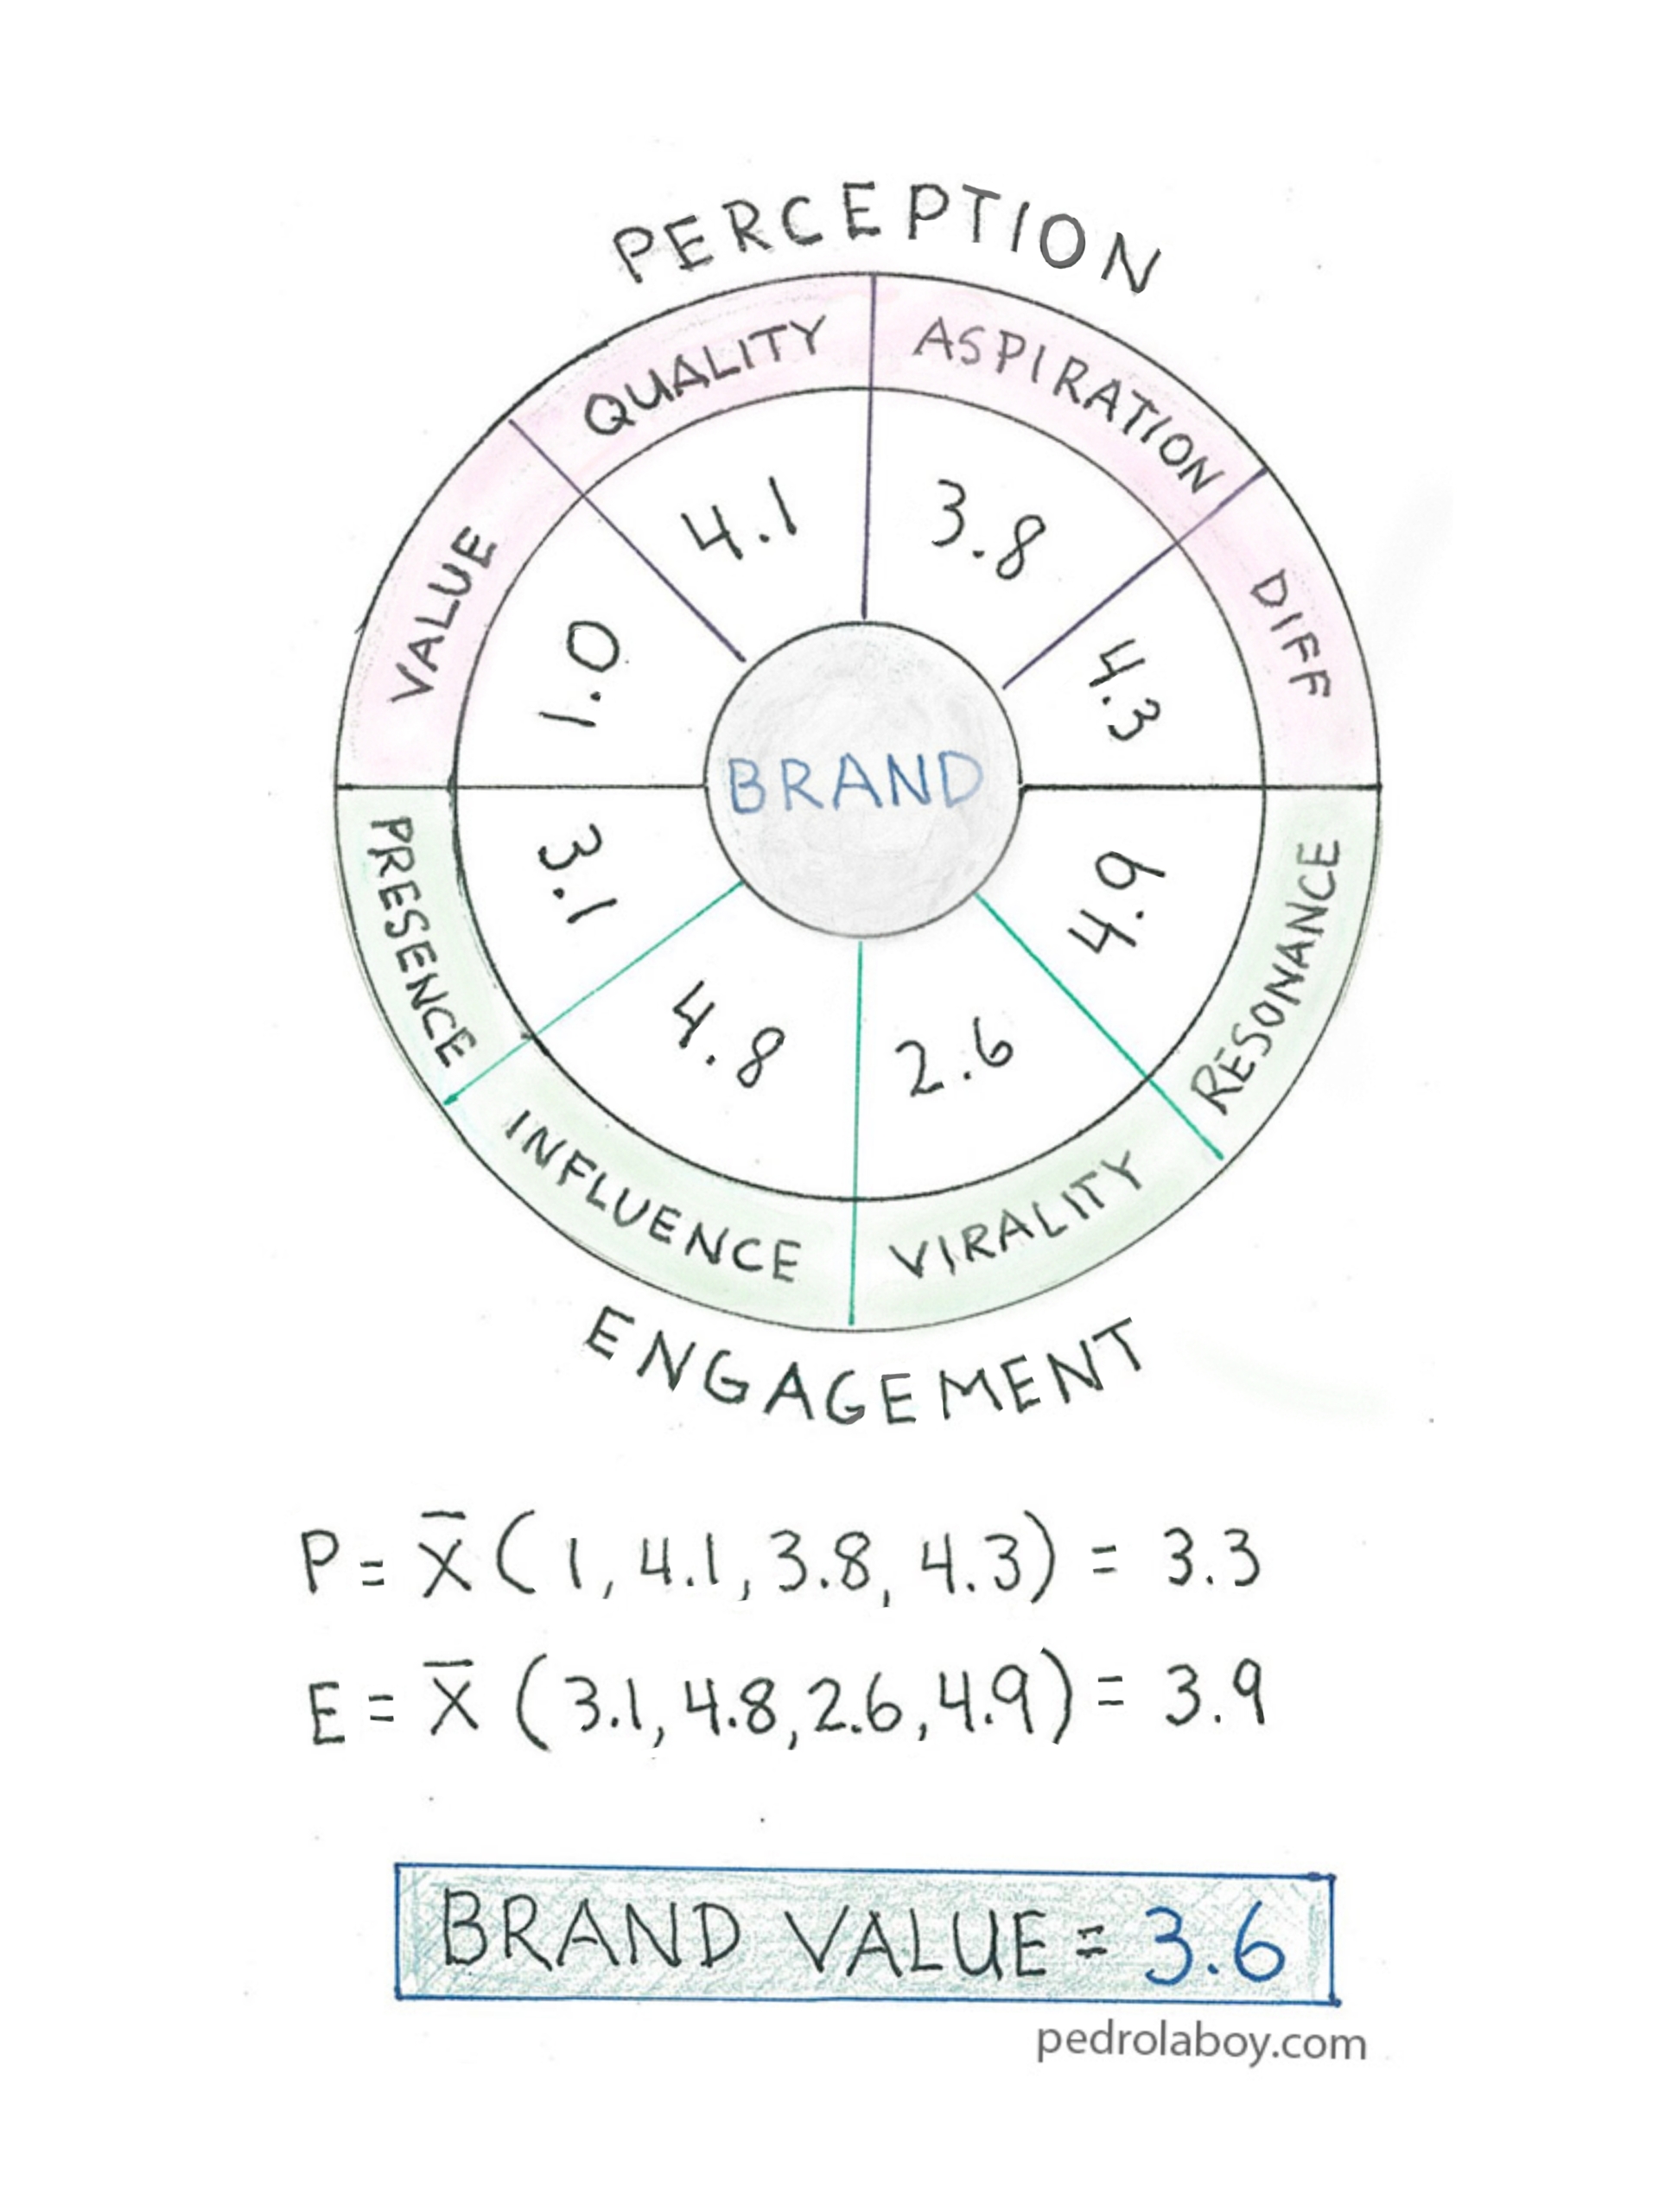
Notebook Thoughts: Using Social Media to Measure Brand Health
Pedro Laboy
May 26, 2019
Read More
1
2