Home
Work
AI Journal
About
Contact
Home
Work
AI Journal
About
Contact
© 2025 Created by
Pedro Laboy
Analytics
22 articles
Home
Analytics
3 mins to read
Notebook Thoughts – Measuring the Customer Journey
Pedro Laboy
July 25, 2018
Read More
#Algorithmic Attribution
#Analytics
#Attribution
#Machine Learning
#Marketing ROI
#Multitouch Attribution
2 mins to read
Notebook Thoughts: Understanding Marketing Attribution
Pedro Laboy
May 30, 2018
Read More
#AdTech
#Analytics
#MarTech
#Technology
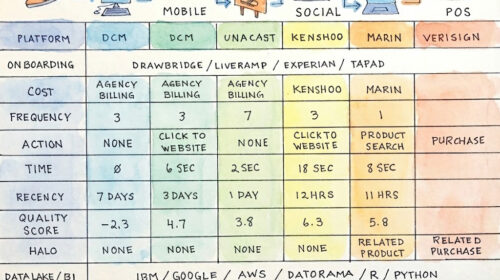
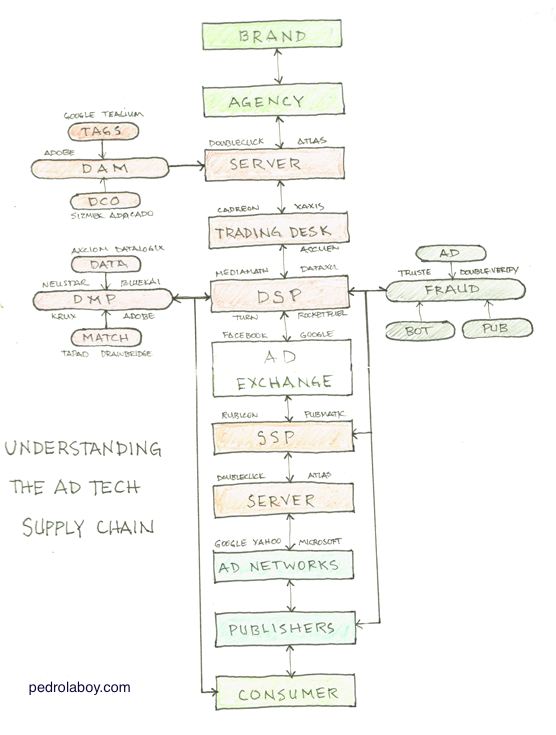
1 min to read
Notebook Thoughts: The AdTech Supply Chain
Pedro Laboy
April 13, 2018
Read More
#Analytics
#Data Science
#Measurement
#ROI
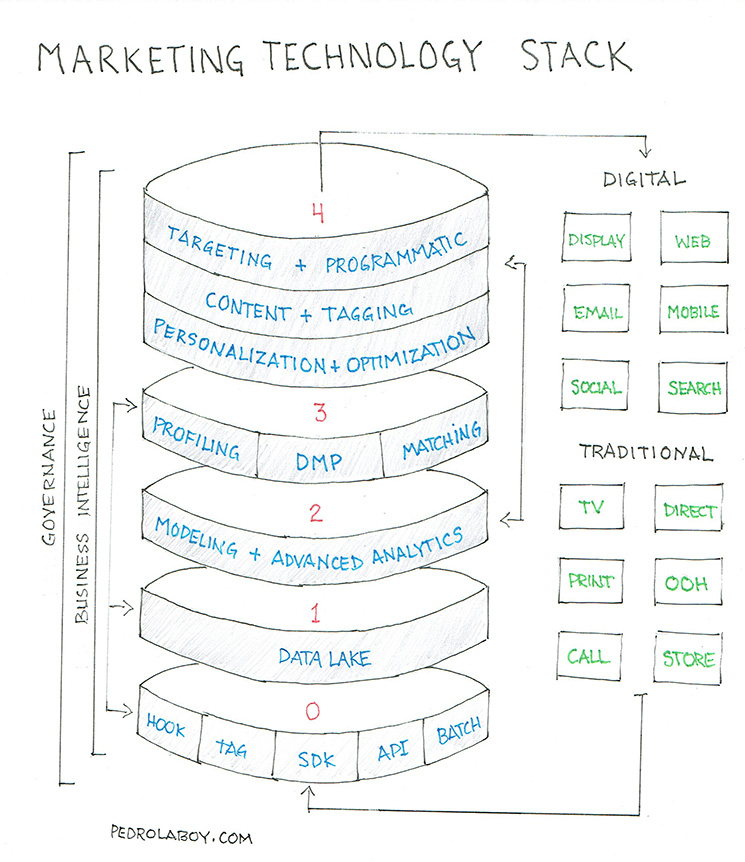
1 min to read
Notebook Thoughts: The Marketing Technology Stack
Pedro Laboy
March 28, 2018
Read More
#Analytics
#Data Science
#Measurement
#ROI
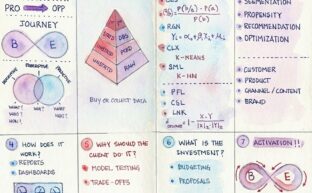
1 min to read
Notebook Thoughts: A Data Science Approach to Marketing
Pedro Laboy
February 23, 2018
Read More
2 mins to read
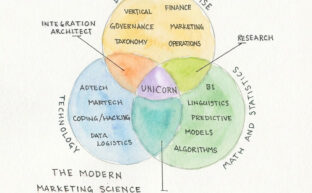
Notebook Thoughts: The Modern Marketing Science Team
Pedro Laboy
December 28, 2017
Read More
1 min to read
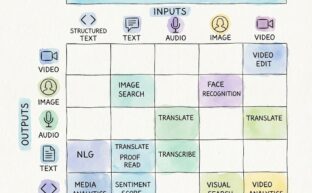
Notebook Thoughts: The Artificial Intelligence Matrix
Pedro Laboy
December 20, 2017
Read More
1 min to read
Notebook Thoughts – The Evolution of Media Measurement
Pedro Laboy
November 19, 2017
Read More
1
2
3
AdTech
agency
AI Agents
Algorithmic Attribution
Algorithms
Analytics
Artifical Intelligence
Attribution
brand health
Business
Business Intelligence
Contextual Targeting
Data Science
data story
digital
digital transformation
ecommerce
LLMs
Machine Learning
Marketing ROI
MarTech
Measurement
media
Multitouch Attribution
Performance
predictive analytics
RAG
retail
ROI
sentiment
SEO
social analytics
social media
strategy
Technology
visualization